I love data!
Yes, I love this Data very much,

but I am actually talking about numbers data. As in, exercise data that really only I care about, but am going to share here anyway!
In 2015, I started an exercise tracking spreadsheet, to use on top of Garmin Connect and the weekly training recaps I post here. I ended up loving using the spreadsheet, and tweaked it a bit as the year went on. You can see a copy of the sheet I created here.
I tracked a lot of info about my runs – who they were with (if anyone), what state they were in, what surface they were on, what time of day they were, and so on. I tracked the coldest and hottest temperature I ran in by month, what I ran in/on (rain/snow/etc.), the amount of doubles (double runs only, not strength or cross doubles), the amount of speed workouts, etc.
I also tracked cross training and strength training, but not in nearly as much detail.
So, I can tell you:
- I ran 309 times this year for a total of 2260 miles. That averages to 7.31 miles per run. My goal for the year was to hit 2000 miles by averaging 40 miles per week. I had 12 weeks where I did not meet my 40 miles goal, however, several weeks were well over 40 miles.
- 95% of my runs were outside.
- 85% of my runs were in Illinois, but I also ran in new to me places this year: Mexico, Minnesota, and Michigan (I also ran in Wisconsin, Iowa, Kansas, Missouri, Indiana, and Texas). The state I had more runs in after Illinois was Iowa at 4.7% .
- I ran 72% of my runs alone. But when I ran with someone, it was likely Kelly – we ran together 36 times (260.71 miles). Gina and Rachel were the people I ran with the most after Kelly – 14 (93.2 miles) and 13 (117.9 miles) times.

Running selfies! From L to R: w/Kelly, w/Gina, w/Rachel
- 59% of my runs were on paved trails or sidewalk (I think this percentage will go down big time in 2016).
- 75% of the runs were single digit runs, and 25% were double digit runs, but 47% of the total mileage came from double digit runs.
- 49% of my runs took place between 6 am and 11:59 am. The least amount of runs took place between 6 pm and 11:59 pm. Surprisingly, 29% took place between 12:00 pm and 5:59 pm – that was new for me this year. This is the year I became less of a morning runner, it seems!
- I did speedwork 56 times (once a week all year long, plus some extra).
- I did 20 doubles (at least one a month) and 7 bricks.
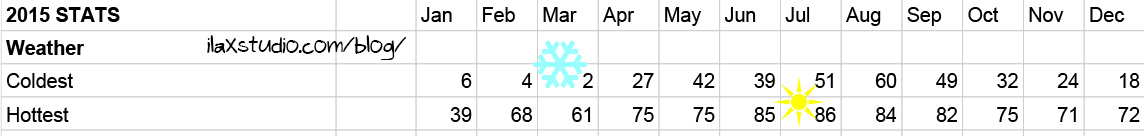
- The coldest I ran in was 2°F in March, and the hottest was 86°F in July. This is a smaller range than years past – most really cold runs were accompanied by bad road conditions, so those runs were indoors, and it didn’t get as hot here this year!
- I rode my bike 59 times (once a week all year long, plus some extra) for a total of 881.4 miles. 34% of those rides were outdoors, the rest were on a trainer (however, that doesn’t mean 34% of those miles were indoors). 4 of the rides were on a mountain bike, the rest were on my road bike.
- I did cross training 15 other times. Ha. Way to be versatile, Kim. I NEVER snowshoed. Eek!
- I taught 117 strength classes, and did 18 strength sessions on my own <— I’d like to see that second number increase in 2016!
Happy 2016! Hope it’s a healthy and happy year for you!

Hi, I’ve been reading your blog for a while and wanted to comment finally. That is data overload and pretty awesome!! I loved seeing your spreadsheet.
Thanks for commenting! 🙂 Happy New Year! 🙂
That is one great year! I’m going to try be more organized about tracking mileage etc next year.
Thanks 🙂 Do you enjoy tracking stuff? I get such a stupid kick out of tracking random crap.
WOO HOO, KIM!!! Way to go!!! I love Data and data, and seeing all of these stats laid out is darned impressive. Cheers to 2016 being even better than 2015!!!
Thanks! And thanks for loving Data too. Ha! Happy 2016!!!
This is truly awesome! I’ve only kept track of my mileage which sadly is less than 1,000 but this is truly marvelous.
Thanks 🙂 Any mileage is good! Any movement of any form is always good 🙂
I love all your number-crunching; it’s so cool. I always want to collect exercise data too, but I never get around to it!
It’s not to late to start for 2016! 🙂
I LOVE this post and your infographic post. Every year. Glad there are other data geeks out there 🙂 So so interesting…totally worth keeping the stats over the year when you can see it all laid out like this!