2015 Racing Statistics
By kilax, January 2, 2016 7:23 am
I wasn’t planning on posting a 2015 race infographic, but my obsessive record keeping made the data simple to find, and the Photoshop file only took an hour to edit (and of course, I enjoyed it)! Here it is! (You can see 2012 here, 2013 here, and 2014 here. You can always find my race stats here.)
Also, if you would like to fill out your own 2015 Racing Statistics in the comments or on your own blog, I created a google doc here for you to copy and fill out/edit!
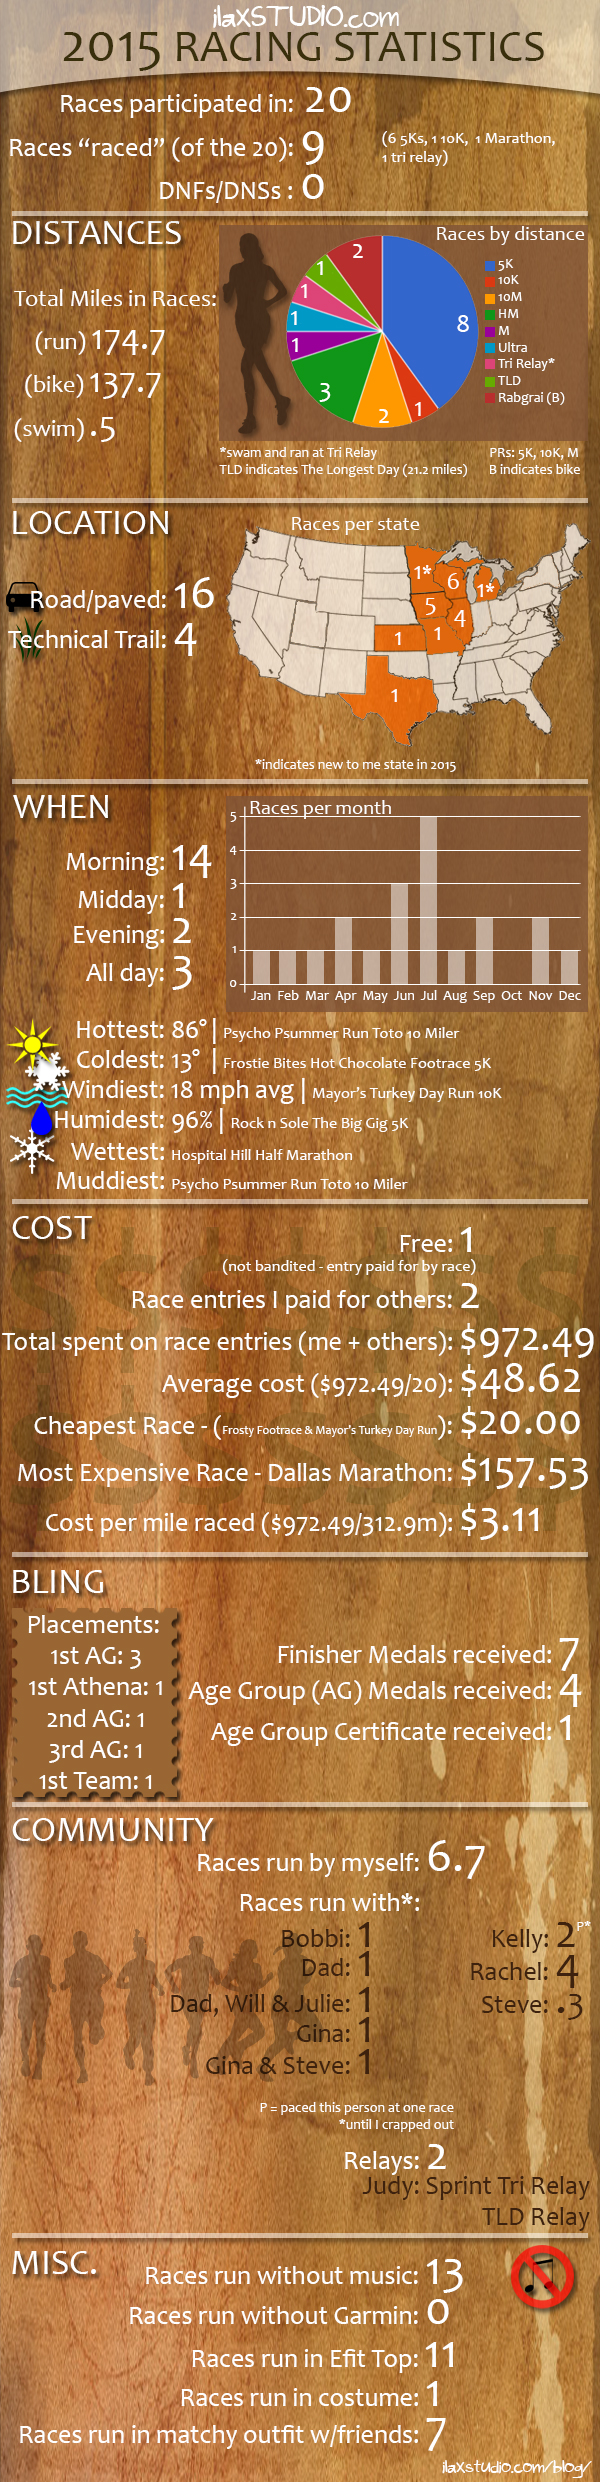
- I did less races this year (this is the least I have done since 2010) and I see that trend continuing. However, I did “race” (I define that as going for a time goal) more than previous years.
- There was a higher percentage of unconventional “races” in the numbers this year – The Longest Day, two days of RAGBRAI, and a triathlon relay. I plan to do the last day of RAGBRAI again this year.
- This is the first year that the most races have not been in Illinois – Wisconsin took the title this year!
- It’s unusual for me to have so many summer races and NONE in October.
- I took favorite medal, bib, and shirt off the infographic because all that stuff is packed away and I can’t go through it, ha ha. But this is definitely my favorite shirt!
- I had a great year of racing, setting personal records in the 5K, 10K and Marathon. The Dallas Marathon was definitely the highlight of the year for me. I did have two horrible races – one because it was so muddy, and one because it was so humid/I was getting over a stomach thing.
- I don’t have many plans for 2016. I am signed up for a 5K, which I plan to race, and I’d like to PR in the half marathon. We’ll see what happens otherwise!

I LOLed when I read that you spent an hour working on that infographic. It’s a neat summary of the year though!
Do you prefer to sign up in advance for races and look forward to them or do them more spontaneously throughout the year? It sounds like the latter for 2016, I guess. And do you have a rough goal for how many races you want to run per year?
Hee hee, thanks!
I like it to be more spontaneous. I am someone who gets overwhelmed when my calendar has “too much” on it, even when it’s fun stuff. 🙂 I don’t have an idea of races per year. I’d like one a month… so 12 would be good? LOL. I am already mostly sure I won’t race in January this year, though 🙂
Yeah I’m glad you did one I always like looking at them!
Thanks 🙂
You had an incredible year! I love my stats and your format is the best! You thought of everything. I remember coveting it last year too. Happy New Year!
Thank you! Feel free to use the format, if you want! Happy New Year!!! I am excited for your marathon!!!
I just love this so much. I love how you track so many metrics- like temp/humidity/who you ran with/wind. It’s definitely cool to look back and see all of that info 🙂
Yay, you did it! Nice work on all those AG finishes – that’s a pretty good total races:AG placement ratio! The stats for your hottest and humidest races make me want to weep. I would be so, so annoyed if I had anything like that for a race of any distance. Give me cold racing weather forever!!
Thanks! I am good at picking races where I have a chance of placing. LOL!!!!!
The hottest race wasn’t that bad because it was shaded! But the mud was OH SO HORRIBLE. Ha.
I love the running temps we have now – 20s-30s. This is good racing weather for me!
Wow, this is very IMPRESSIVE!!!
Very awesome and so impressive.